Recently I received an offer from my broker which I found intriguing. The brochure had a big title at the top: “FTSE 100 8.75% Autocall”. Wow, that’s a great return! Government bonds are giving me negative return when I take inflation into account, the FTSE is at levels it first reached in 1998, and I already own a lot of corporate bonds which are yielding about 4%, so 8.75% is a return that caught my eye just as it was designed to do. So I applied my two rules of investing:
Rule 1: Don’t buy something you don’t understand
Rule 2: If something sounds too good to be true then it probably isn’t
Fortunately I could tick rule number 1 because I’d taught classes on exotic options, including autocallables, so I know roughly how they work. The first aim of this article is to bring you up to speed on autocallables to help you decide if they’re for you. The second aim is to see in detail what return you are likely to receive with an autocallable and what you might receive if you’re unlucky. This return may be dramatically different from the percentage you see in the product title.
The deal with an autocallable is as follows. Say we have a stock index, let’s call it the Tootsie, and the Tootsie is trading today at 1,000. Let’s say that today, on October 1st 2012, we invest $10,000 in a five year autocallable on the Tootsie that offers 10%. The amount you get paid, and when you get paid, depends on the level of the Tootsie on just four dates: October 1st 2014, October 1st 2015, October 1st 2016, October 1st 2017. A big selling point of autocallables over buying the index itself is that you get capital protection. Even if the index falls below its initial level (but not too far as we will see) you still get back your initial investment of $10,000.
In this example the autocallable is not callable for the first year, as was the case in the brochure I received, and the product had a fairly typical clause which limited my capital protection if the index fell below a certain value during its lifetime (50% of its initial level in this example).
| If… | …then get |
|
| Oct 1st 2013 | No cash flows as first year not callable | |
| Oct 1st 2014 | Index greater than 1000 | Receive $12,000 |
| Oct 1st 2015 | Index greater than 1000 | Receive $13,000 |
| Oct 1st 2016 | Index greater than 1000 | Receive $14,000 |
| Oct 1st 2017 | Index greater than 1000 Index less than 1000, never below 500 Index less than 1000, touched 500 |
Receive $15,000 Receive $10,000 Receive $I*10 |
Here are the cash flows as a flow diagram. Cash flows are shown in red, and decision points are shown in blue. Time flows downward.
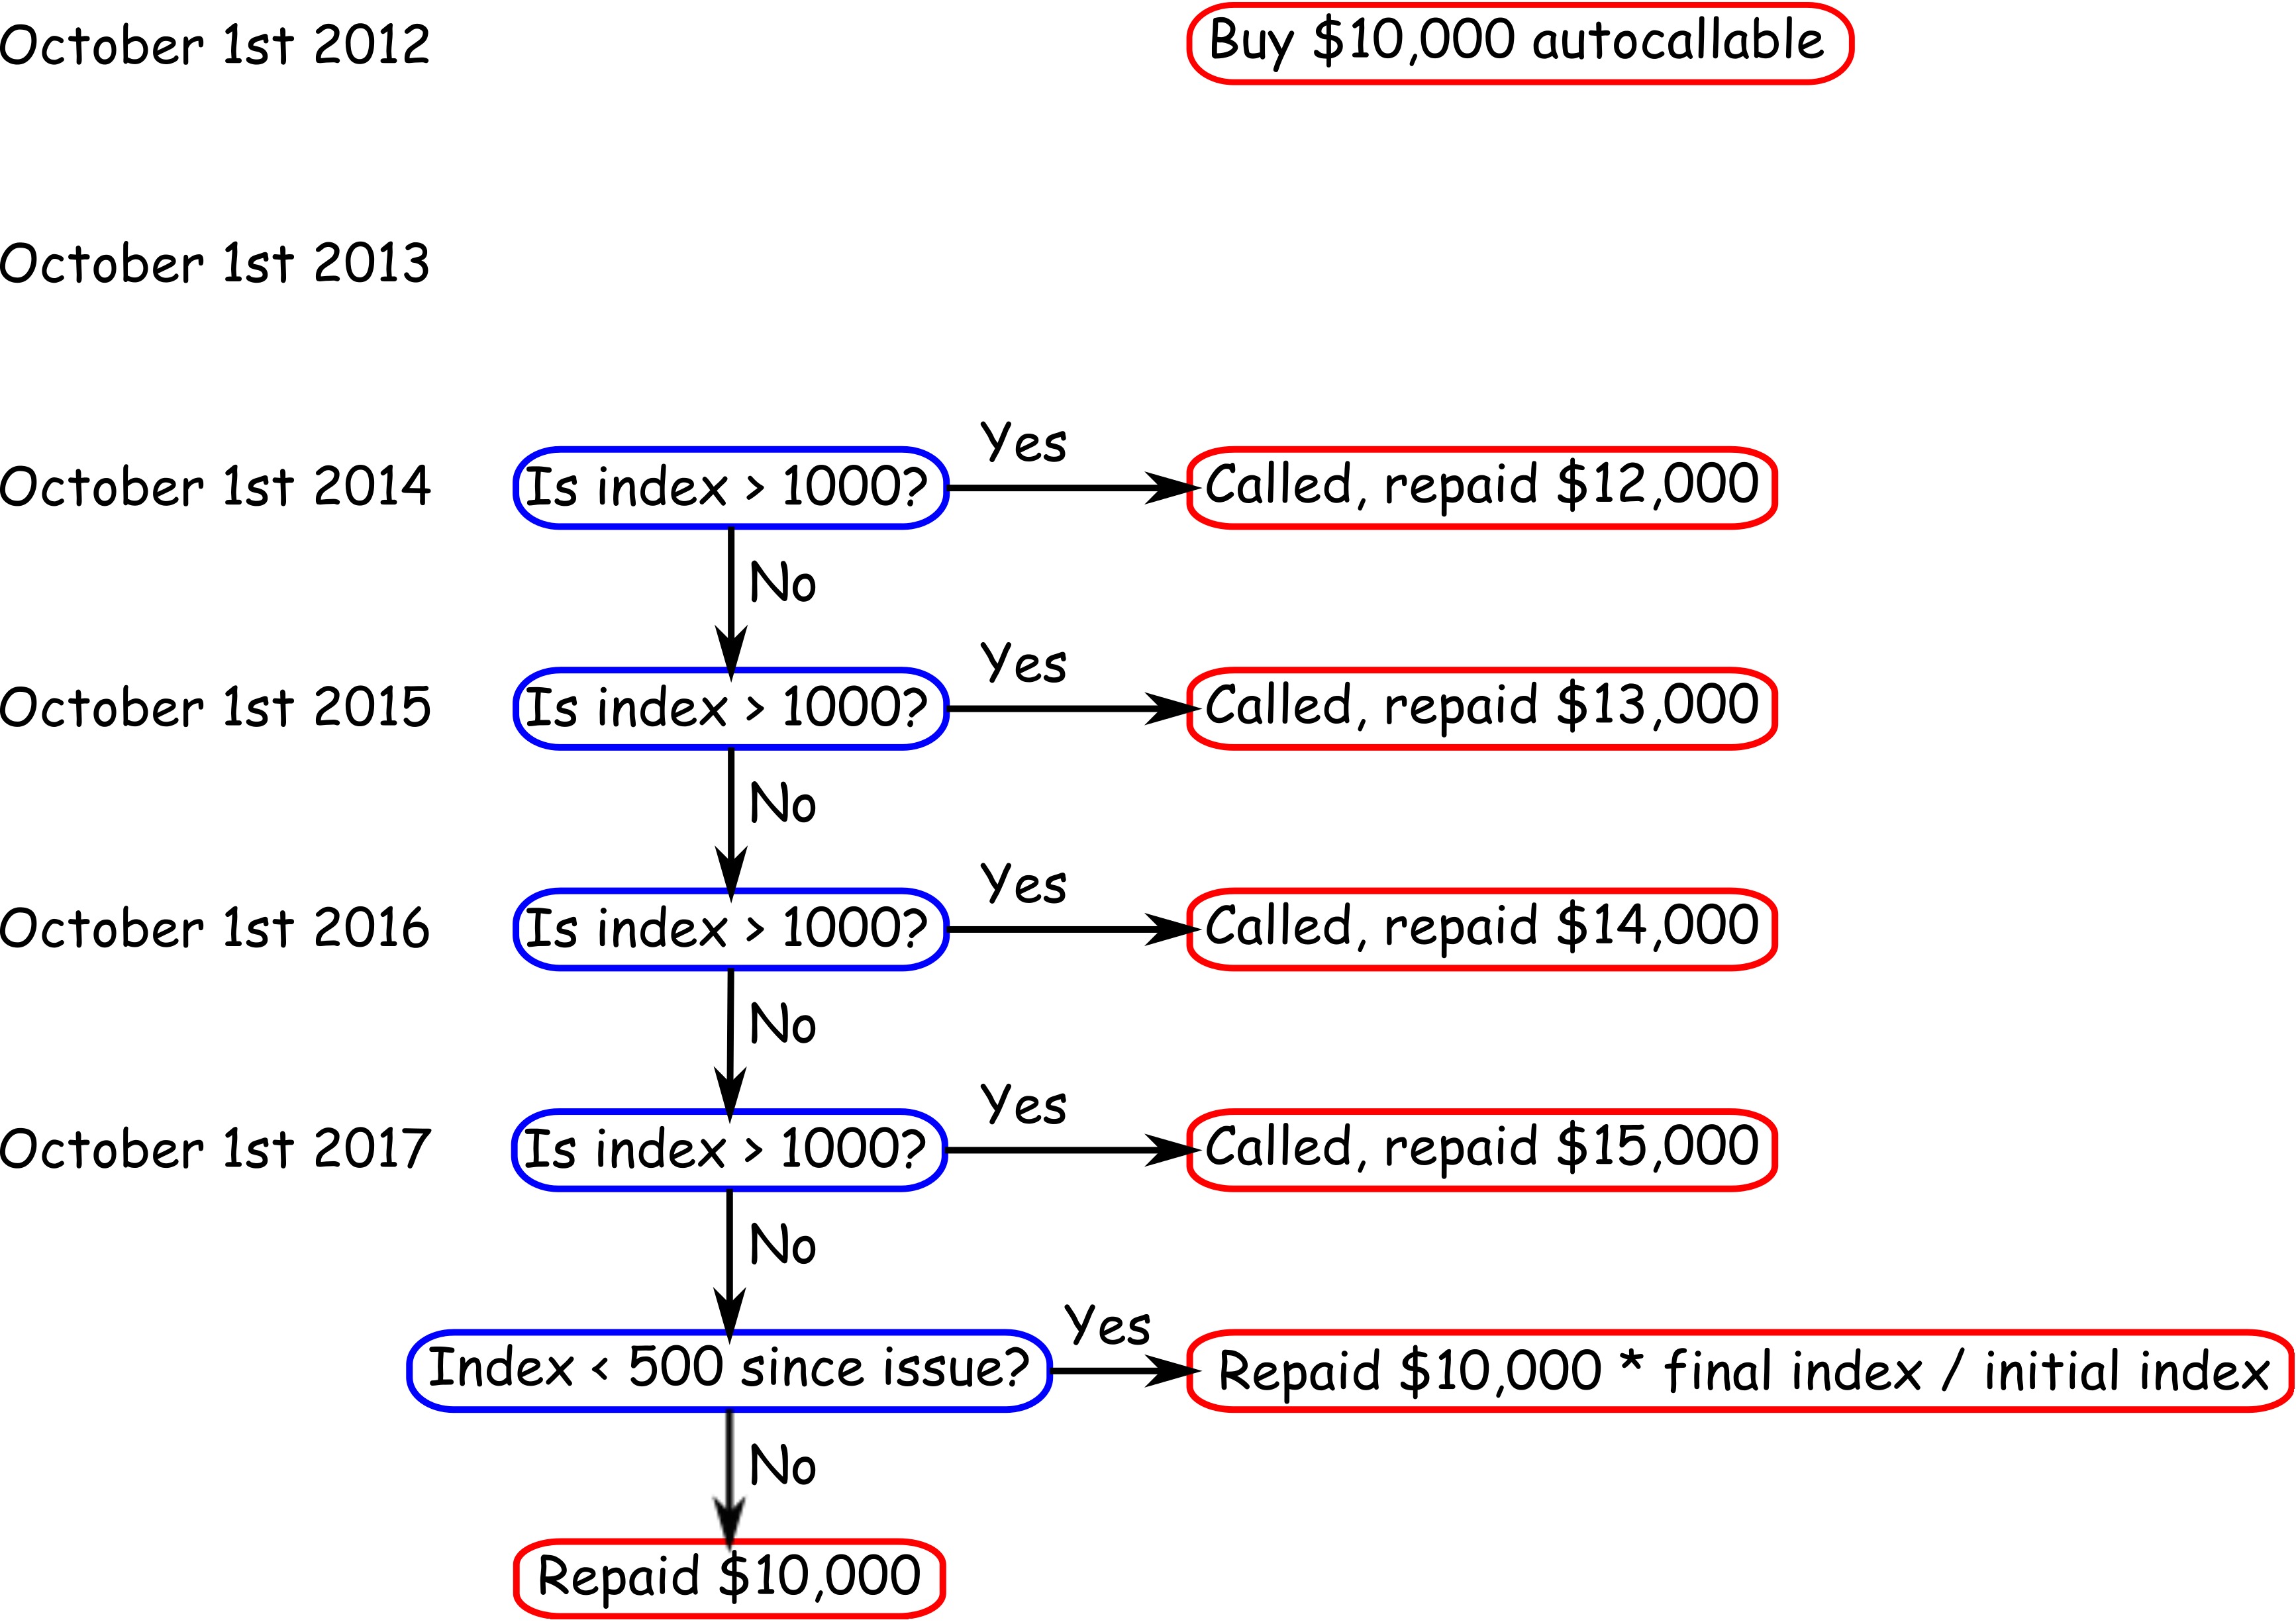
The autocallable is called on one of the four dates, and the amount you get paid depends on the level of the index on that date. On the final date in 2017 the amount you receive if you have lost your capital protection depends on the level of the index on October 1st. If the index was at 700, say, then you would receive your initial capital of $10,000 multiplied by the index level of 700 divided by the initial level of the index on October 1st 2012, which was 1000. This means you get $7,000 back which is a loss of $3,000.
Now that we know the cash flows we can start to ask a few questions.
How long will my capital be tied up?
This depends on the level of the Tootsie on the four critical dates: October 1st 2014, 2015, 2016 and 2017. The “called” in “autocallable” means that the product is terminated and you are repaid your capital plus any interest. This call process is automatic because the date on which the product it is called is determined by the movement of a market variable and not by the issuer or by you the investor. So what we can say for certain is that you will be tying up your capital for at least two years, and possibly for a full five years.
Five years is a long time. A lot of things can happen in five years not just to stock markets but to me. What if I lost my job? What if I needed cash in an emergency? For this reason you should only invest money that you know you won’t need for the next five years in this product.
Of course you can sell the product back to the issuer before the product calls, but usually you will take a big hit in terms of bid-offer spread if you do so. Unlike a stock, where millions of trades are made in the secondary market each day through many competing market makers, a structured product like an autocallable usually has only one market maker. This is the issuer. Once you redeem your investment they lose some of their funding so they will not be financially motivated to do so.
What’s my upside?
This is the beautiful face of autocallables. The best possible outcome is that the Tootsie is below 1000, and therefore does not get called, on the 2014, 2015, and 2016 call dates then finally rises above 1000 on October 1st 2017. In this case you will be a very happy investor indeed. You will have received a very respectable return of 10% for five years running and for your initial investment of $10,000 you will now be repaid $18,000. Hmmmm… nice.
If the autocallable called on the 2016 call date you receive $16,000 back. Still that’s pretty good, right? Or even if it calls in 2015 you get $14,000 and that’s great too. It turns out, as we will see, that what’s rather likely is that the product will be called on the first call date in 2014, so you’ll get $12,000. That’s still a respectable return, but if you want to try and repeat the outcome you’ll have to buy another autocallable.
What’s my downside?
The worst that can happen is that you will lose all of your investment. This could happen because the product is usually in the form of a note. In other words when you pay your $10,000 you are buying a bond issued by the autocallable issuer. Buying a bond just means lending money. When you lend money there’s a risk that the person to whom the money is given will not be able to repay because they become insolvent. So one of the risks in this autocallable note is credit risk. You should therefore be very cautious of the company’s credit risk, and so their credit rating matters. A highly rated issuer should, in theory at least, have a very low probability of default.
If the issuer does go into bankruptcy you will find yourself in line with other creditors who are trying to reclaim their assets using the proceeds of selling the company’s assets. Optimistically you might receive back about 40% of your capital for a typical investment grade company.
Another risk is from the loss of capital protection if the index falls belows some critical level, which was 500 in our example. What’s worrying about this clause is that it does not depend on the four call dates. Your capital protection disappears if the Tootsie falls below 500 on any trading day over the life of the product. As long as this does not happen you keep your initial $10,000 protected and this gives some peace of mind that you would not have if you just bought an ETF that tracked the Tootsie.
What return will I actually be paid?
The answer is far from simple and can be summarized by one word: unknown. Fortunately the cash flows are a known unknown and there’s a beautiful way to explore the possibilities known as Monte Carlo simulation. Remember that the cash flows vary depending on the level of the Tootsie index such that if you knew what the index level in the future you would know with certainty what the cash flows would be. We can simulate thousands of different, but plausible, future paths for the Tootsie index and for each path make a note of the cash flows, and the amount we would be repaid with the autocallable. What we end up with is a distribution of returns. We can also assign probabilities to each outcome on our cash flow decision tree.
In order to simulate the future of an index we need to make some assumptions about how its price behaves. There is a huge body of research on how this can be done. We will keep it simple and assume the price of the index is a random walk with a drift term. The drift is the long-term return of the index and we will assume that the daily log-returns are Normally distributed (or equivalently that the daily returns are a Log-normal distribution). In practice stock indices and asset prices tend to be more complicated. For our simple model we need specify just two numbers: an annual drift rate and an annual volatility both of which we can estimate from historical prices or based on our own belief about future return and volatility.
Assuming a drift of 5% per year, volatility of 20% then we can run 10,000 plausible paths for the Tootsie and see what we get. The results are quite surprising.
| Outcome | Payoff | Probability |
| Called Year 2 | $12,000 | 58.7% |
| Called Year 3 | $13,000 | 10.5% |
| Called Year 4 | $14,000 | 6.0% |
| Called Year 5 | $15,000 | 3.9% |
| Matured without protection | Depends | 6.4% |
| Matured with protection | $10,000 | 14.5% |
By far the most likely outcome, with a probability of about 60%, is that the note will be called and you will be repaid $12,000 at the first available opportunity after two years. The dream payoff of $15,000 is extremely unlikely because the Tootsie has to behave very oddly to get there. It must be below 1000 on the year 2, 3, and 4 observation dates then rally above 1000 in time for the year 5 observation date. The simulations show that a drift upward or downward over five years is most likely, so hanging around under 1000 then shooting up at the last minute is improbable.
Is the protection worthwhile? In about 20% of the simulations the Tootsie was not called for all five years and ended up below its starting value of 1000 on the final observation date in year five. The critical question for the autocallable is whether the Tootsie touched 500 during its lifetime because this loses protection. Protection helped twice as often as it did not, such that we got our initial investment back 15% of the time and didn’t 6.4% of the time. We can draw a picture of the probability distribution of our payoffs. This is useful because it summarizes the outcome of thousands of scenarios in terms of what we really care about: return.
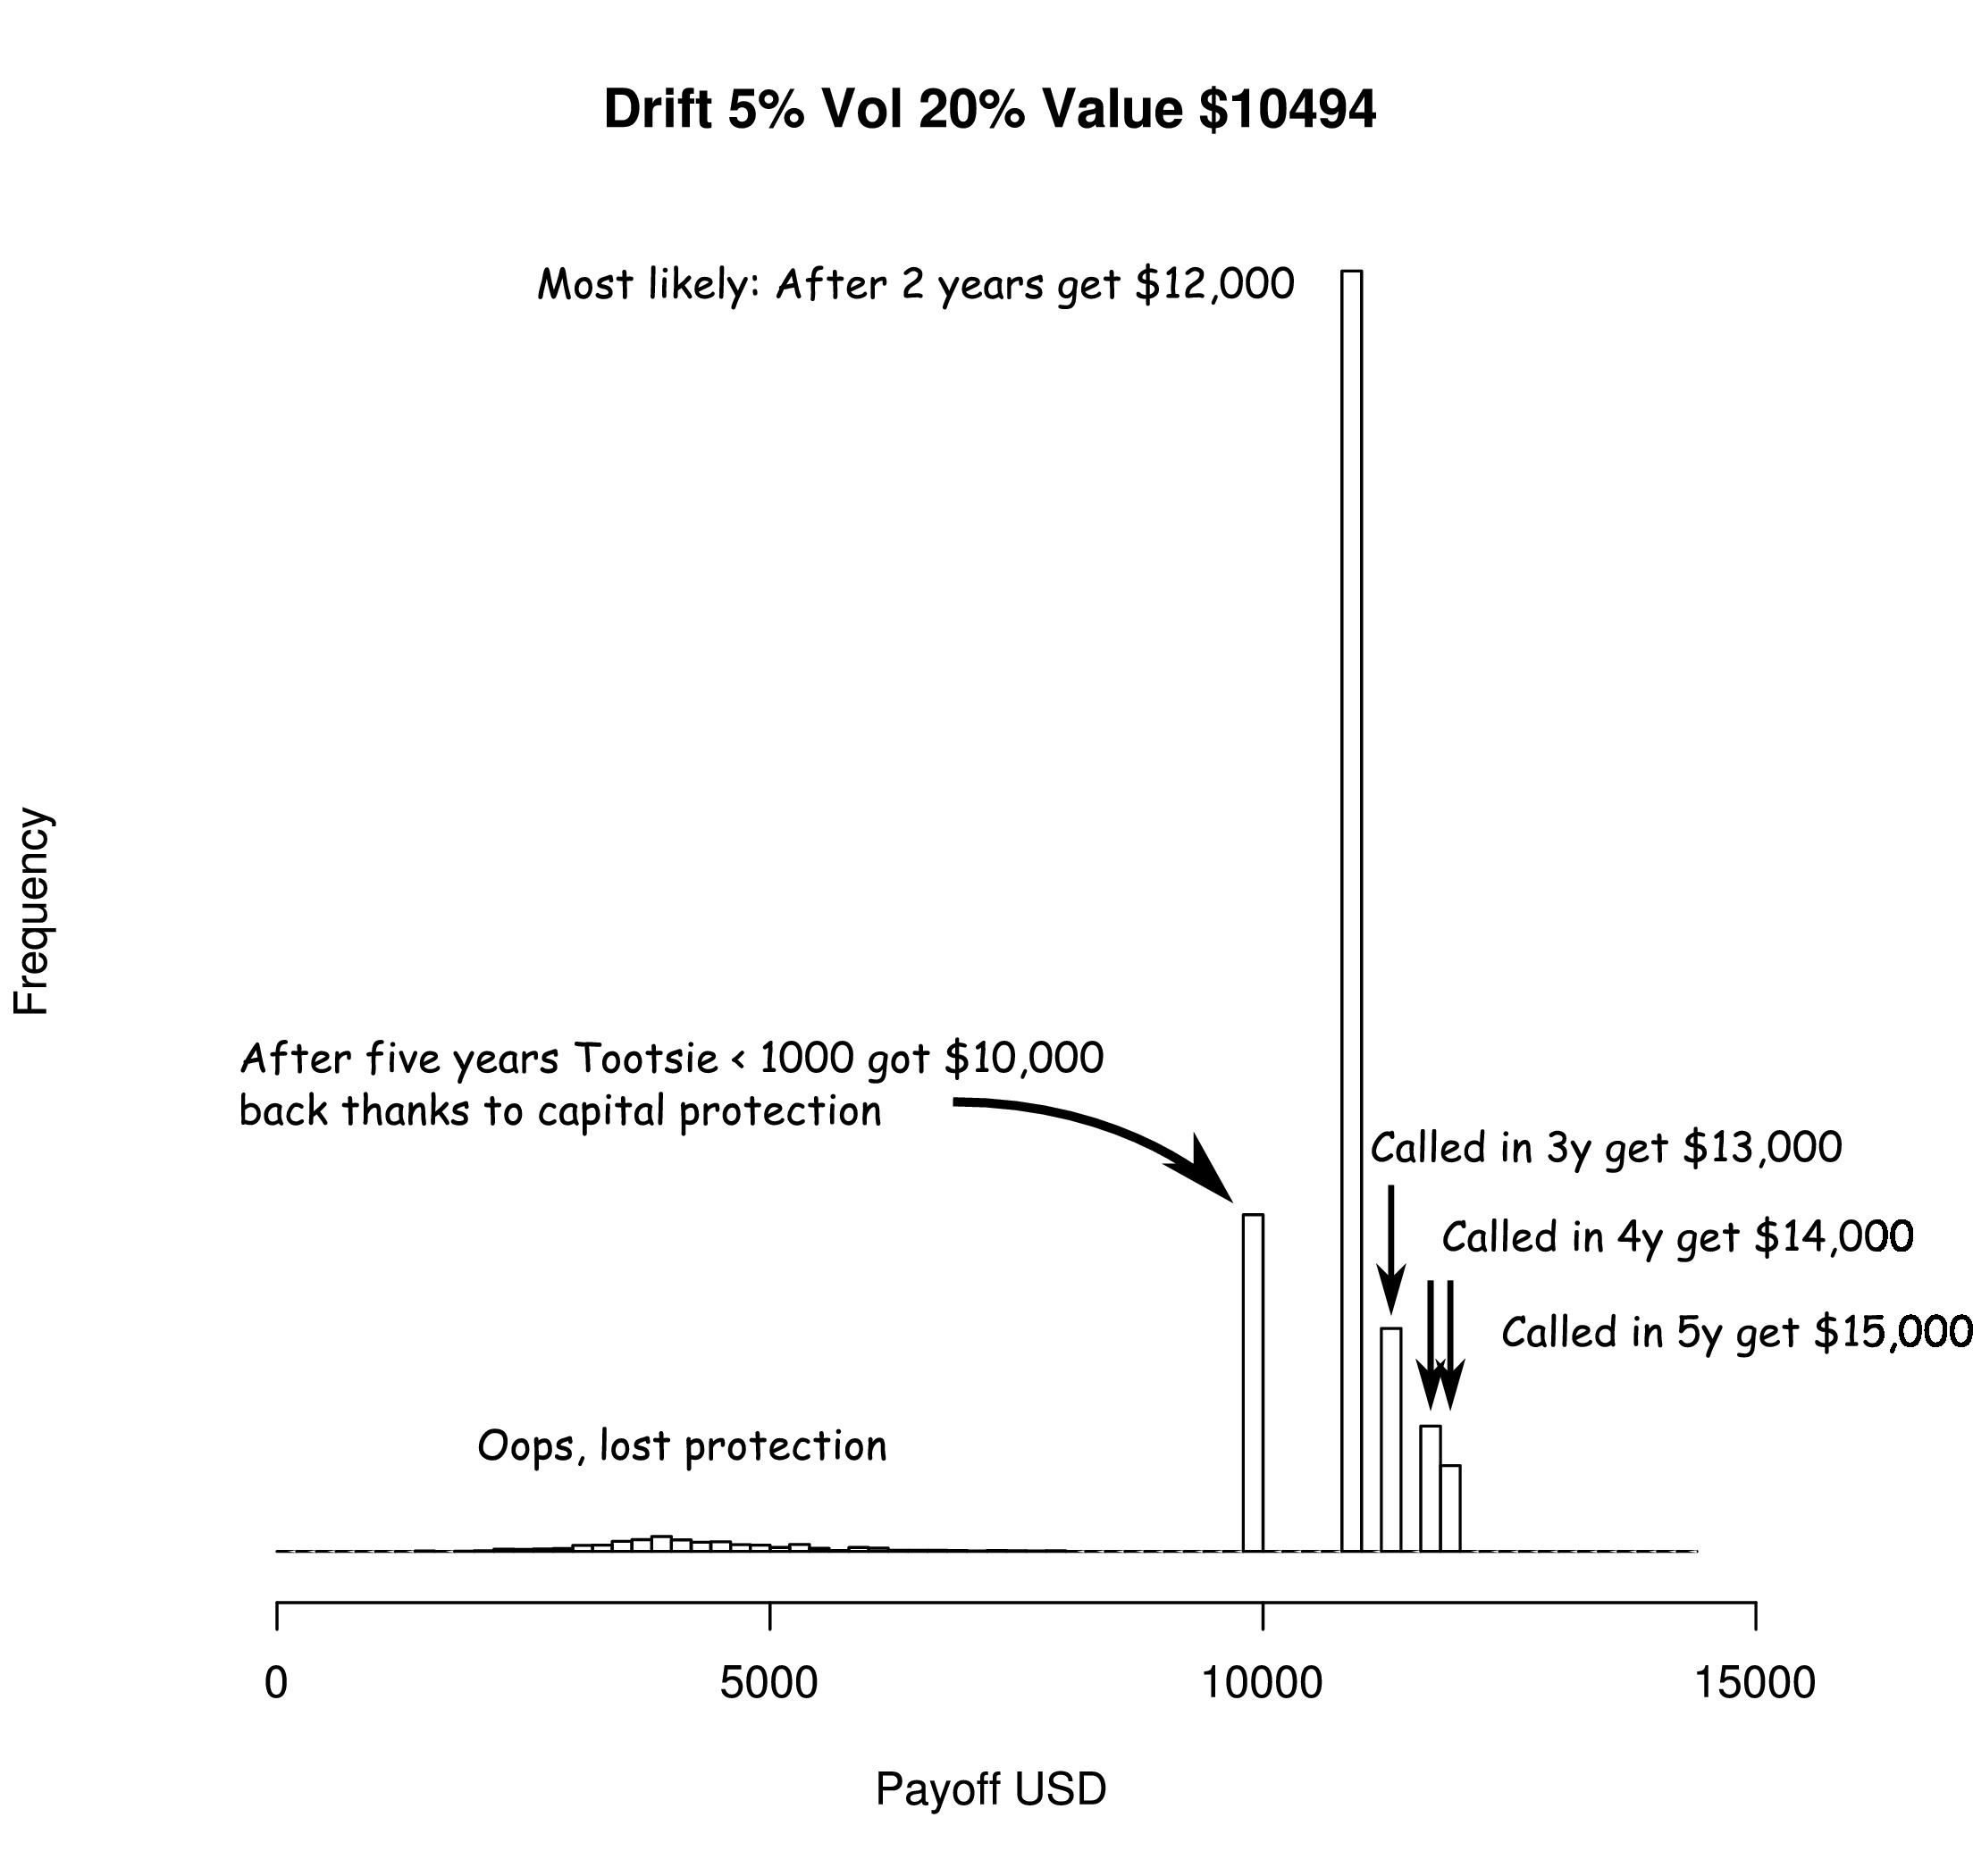
The most likely outcome in this chart is immediately obvious: the big bar with a payoff of 12,000 in two years. Notice how very quickly the probabilty falls off for the 3y payoff of $13,000 and 4y payoff of $14,000 and 5y payoff of $15,000. I assumed a risk-free interest rate of 5% so the effect of discounting is not very evident, but these are present values which explains why the payoff of $15,000 appears to be less than $15,000 (present value of $15,000 is $11,752).
It is also rather likely (15%) that after five years you just get your $10,000 back. Okay, in this scenario the Tootsie would have performed disastrously but I suspect that getting no return on your capital for five years would not be cause for celebration in your household. More worrying still is the spatter of outcomes (probability 6%) where the Tootsie touched 500 over five years, you lost your capital protection, and the product was never called. In this case your average payoff would be around $4,200, a loss of half your capital and no doubt a very upsetting outcome.
Were my assumptions about drift and volatility unreasonable?
The outcomes are quite complex and depend on your assumptions about how the stock index underlying the product behaves. We can boil all these outcomes down to a single number: the expected return. This is the product of each payoff multiplied by its probability of occurring. When annualized this turns out to be about 2.4%, which is much less than the 10% you see in the product description.
We’ve tried a drift of 5% and a volatility of 20%, what if we were to vary the drift and the volatility. In the grid below we show 15 pairs of values for drift and volatility. As we move down the grid drift increases from a disastrous -20% to a breathtaking +20%. Volatility increases from a very subdued 10% on the left to +30% on the right.
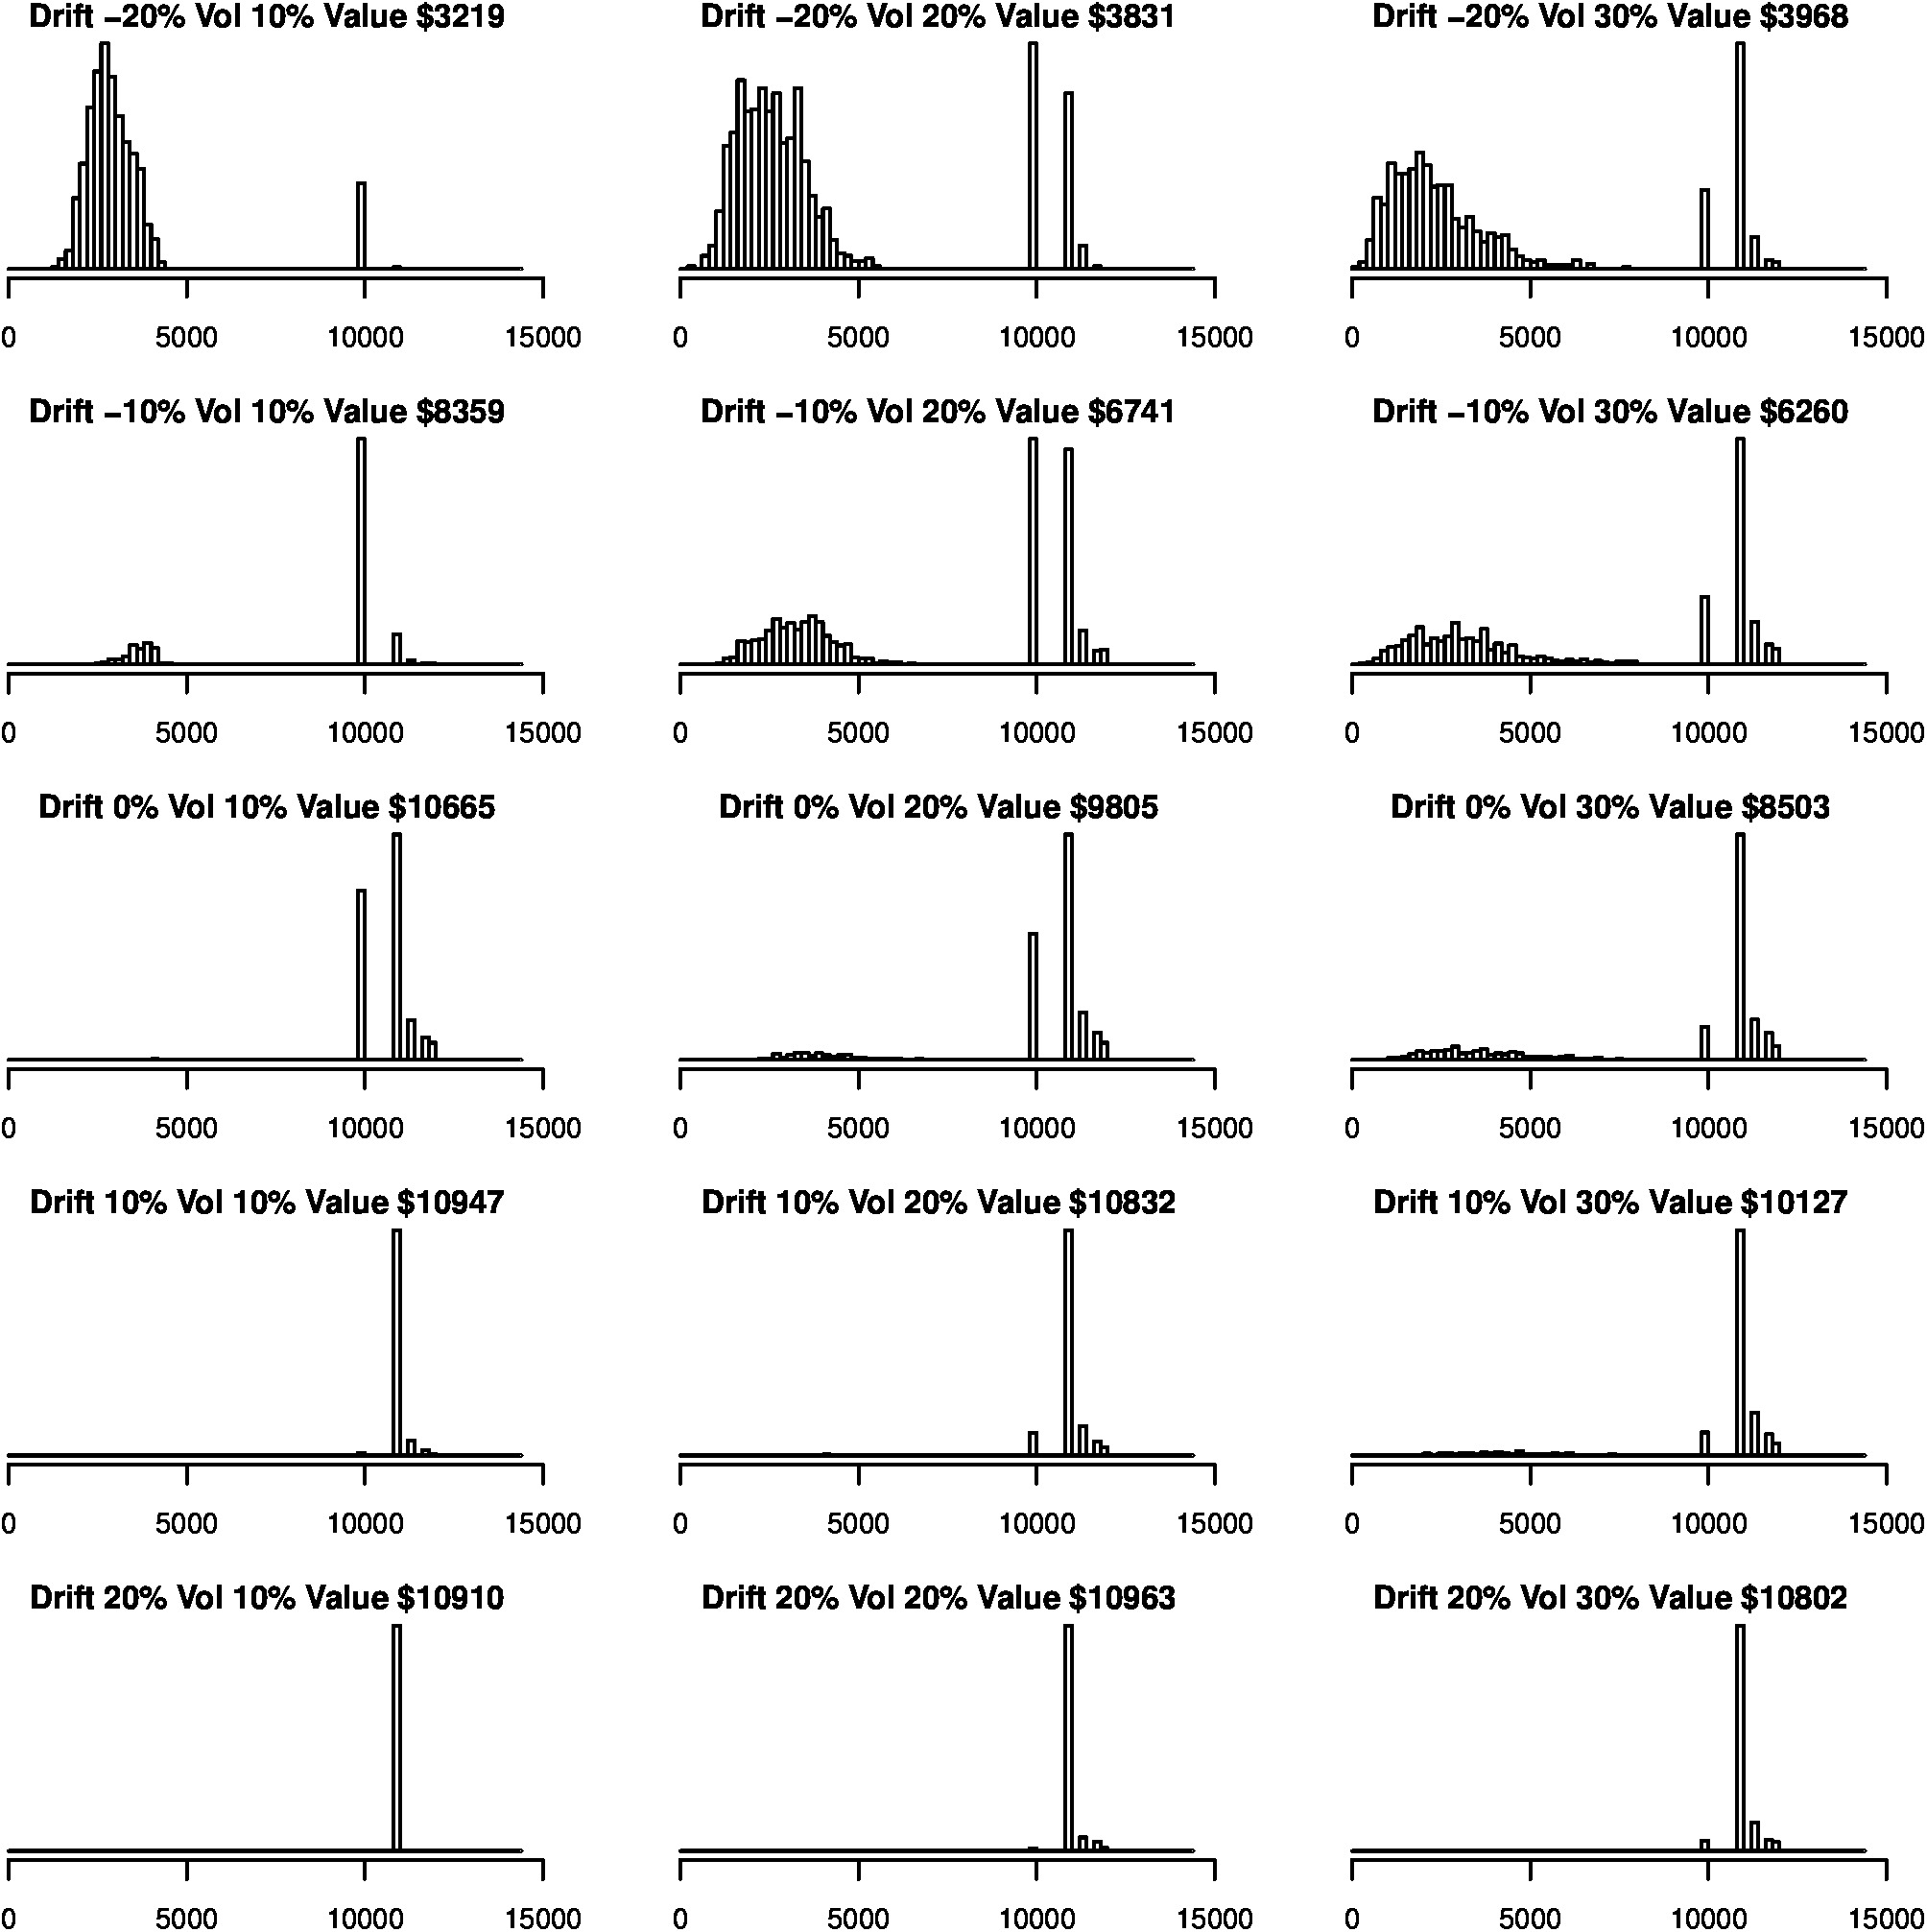
If the drift is -20% (top row above) the share index will fall rapidly each year. The only salvation for this scenario is a high volatility because sometimes this overcomes the drift and generates a high payoff. The average payoff is very low, in the $3,300 to $3,900 range. Most of the time the index touches 500 and you lose your capital protection. If the drift is very positive you start to see the other problem with this product: the upside is limited. Even if the Tootsie index rockets up at a rate of +20% per year the product is still very likely to call in year 2, and your average payoff is usually below $11,000.
These simple simulations show that the autocallable is best if you expect a moderate positive drift of the index and a dairly low volatility. If you expect the index to shoot up you are better off buying the index itself, particularly as you will receive dividends with many share index ETFs. You don’t get dividends with most equity index autocallables. If you think the index may fall dramatically and you want capital protection then this product is also not appropriate, as a steep fall will probably hit the 500 limit and you will lose any capital protection.
Now the question you have to ask yourself is whether you understand the risks and benefits of this product. For those who can do this kind of analysis and then consider whether, in the light of their beliefs about drift and volatility, this product is beneficial they can make an informed decision. But could you explain this to someone without a finance background?
Want more?
If you liked this description of autocallables, which is taken from my book “A Financial Bestiary”, and you want to learn more about finance explained in a simple way, then buy my book by clicking on the links below for Amazon USA and Amazon UK. Clicking on the cart buttons will buy you the PDF version which you can read on your tablet or laptop. And if you’d like me to explain anything else get in touch by email by clicking on my image on the home page. Thanks for reading!